Alright, in our last post we highlighted some key Analytics terms you should be familiar with, especially if you’re going to be reading reports on your digital marketing efforts. Hopefully you studied up! Today we’re talking about navigating to subsets of data within Google Analytics that we think you should become familiar with first, and knowing those terms will help you understand what you’re seeing. We understand that every business is unique, with shifting needs and goals that can definitely be applied and captured within Analytics, but exploring all of Google Analytics’ capabilities with you could take awhile. Not that we don’t want to spend extra time with you -that sounds awesome- but let’s save it for September’s hangout!
Google Analytics has way more capability than we’re going to talk about today, and even though we know you’re a smarty pants who could handle a full tutorial, we wanted to stay pretty basic with this post. We know most of you just want to be able to check-in on your website…see how it’s doing, if it needs anything…you know, because your business can be your second child. This popular reporting tool is widely used because it’s customizable, nicely organized, and the plethora of data keeps you in the loop. You get to see a lot of information about what’s going on with your site, after putting just a small amount of code on the backend.
“Ok yes, data is very useful and good, but this is overwhelming to stumble through. What am I looking at?!” Never fear, Rock Paper Simple is here!
Creating or logging into your existing account is easy. Head over to Google.com/analytics to get started. It will be tied to an existing google account or you can make a new one. Keep in mind Analytics lets you add/revoke user access under Admin, so we recommend having a business Gmail account to associate with your Analytics account, and you can add team members later on if certain people need to see it.
After logging in to your account you’ll see the major categories of Home, Reporting, Customization, and Admin across the top. Home is simply a list overview of client accounts, Customization lets you compile specific reports to email out, and Admin is well, Admin. In there you create property clients and add their website accounts, and if you’re new to Google Analytics you’ll be directed on how to set up web tracking. If you need help with this process, contact the team here. If you’re good to go, read on!
For now we’re going to tell you to just focus on the Reporting tab and forget about those other tabs, because all the fun stuff lives under Reporting. The core of Google Analytics is there, so it makes sense for us to skip to the good part, right? Under Reporting, click through each subsection on the left sidebar. You’ll see the top four sections are user tools that can help simplify and customize your Google Analytics experience. We’re going to skip over those too, but they are useful to know about so here’s a quick description:
Dashboard – Super handy, and first under Reporting for a reason. You can pick and choose subsets of data to see, creating a unique visual for you to speedily analyze accounts. If you’re not interested in navigating Analytics to see your reports the standard way, this is for you!
Shortcuts – If you need to check in routinely with a specific account, then you should create a shortcut to that report. It’s not saving too much time, but you’ll look like a wizard at your next meeting when you pull up the numbers your boss wants to see with speed and ease.
Intelligence Events – You can set up alerts to be notified when Analytics receives data on criteria you specify, or when data is abnormal. This can be useful when tracking activity after a major campaign or implementation of something new.
Real Time – Exactly what it sounds like! Be the spymaster you always wanted to be and watch top referrals, pages, search activity, top locations, and more… all in real time!
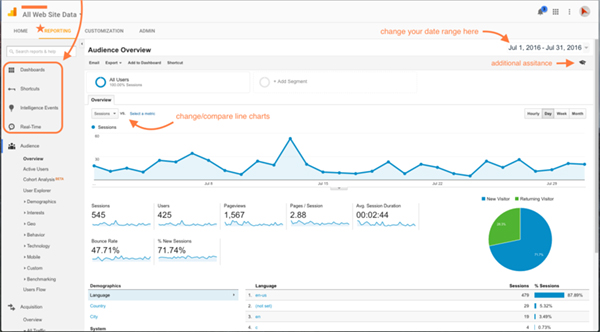
Underneath those are (arguably) the most important sections- Audience, Acquisition, and Behavior. When you look at their Overview sections, you can see a standard report that provides a line chart of data from a specified time range, and more illustrative data charts beneath that. Thankfully Google understands that numbers can get overwhelming, so they’ve included many chart options for us Right-Brained thinkers who like a more visual representation of data. The default line chart shows data for Sessions, but you can choose which data shows in the dropdown right above the chart. You can also add another data line for comparison!
Overviews are helpful when you want “at-a-glance” updates about your site, but for most of you who want a little more information about what those numbers mean for business, we recommend heading straight to a couple of places:
First is Acquisition -> All Traffic -> Referrals.
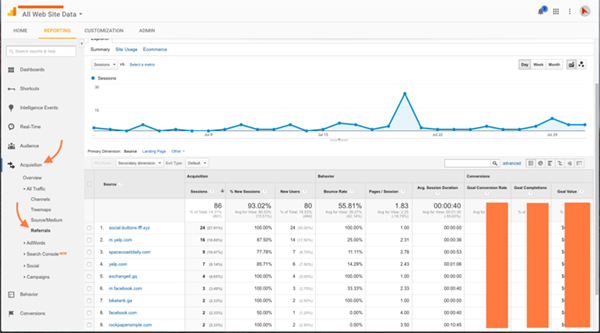
Referral reports are a great way to see where your traffic is coming from and the quality of that traffic. With this report you can see the specific pages that are bringing viewers to your site, and their associated bounce rate and session data. This is can be the most important report for a lot of people (shortcut worthy!). It provides a visual outcome of marketing efforts, leading businesses to make better decisions on whether to amplify, change, or quit those efforts accordingly.
Another good place to start is Behavior -> Site Content -> All Pages.
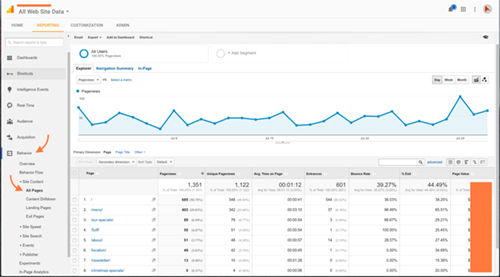
The data within Site Content gives you a breakdown of user behavior. Here you can see total pageviews, entrance and exit value of pages, and where users navigate to after they land on your site. For example this restaurant has the most pageviews on the homepage (/) but people stay the longest on the /about/ page, signaling their interest in reading through content on the atmosphere and dining experience. This data is super helpful to look at because you can see which pages are aiding or hindering the flow of a user’s experience- telling you if you should beef up your page’s content, if your SEO needs work, and other valuable info!
Confident in Getting to Those Places? Browse around within Reporting!
Once you become a little more comfortable exploring Google Analytics, we recommend playing around with sections under Audience. In here you can see your global marketing reach, enable demographic data pulling, know which technology is being used to find your website, add segments to track social media traffic, and more. With this knowledge it becomes easier to better target your marketing efforts, and you can be smarter about captivating users. It sounds like a lot, and it is, but it’s worth learning more about. Also, when your clicking around subsections, don’t forget to click on the blue links in your tables! They allow you to see even more subsets of related data. For example if you see in Audience -> Geo -> Location that most of your sessions originate in the U.S., follow the links to see state rankings, and further to see which cities in that state are top visitors of your site. If you need additional assistance or information about what something is, remember that you can click on the little graduation hat icon that hangs out under the date range! Google does a good job of defining things and helping Analytics stay user-friendly.
Wrapping it all up…
Google Analytics is a great tool that lets you see data for just about any custom inquiry you can come up with. What you do with that data is the important part! If you get really into exploring Analytics and you enjoying checking numbers, there’s potential for it to become a powerful tool in expanding your business, and we’d like to talk to you about that. However after all this, if you decide that numbers just aren’t your thing (or you’d rather get simple reports from us) we can certainly talk about that too! If you have any questions, or you’re interested in getting an analytical report sent to you in plain English, call us or drop a message here.
